 |
||
|
||
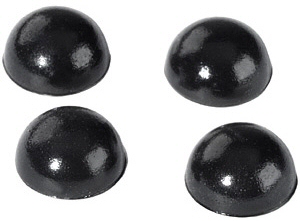
The first loudspeaker isolation product I know of is Auralex MoPADs, shown at left. These blocks of foam claim to prevent the vibration of a loudspeaker from transferring to the surface it rests on. The theory is that speaker cabinets vibrate, and expand and contract, as the woofer cone moves in and out. So without isolation the table or other surface also vibrates, thereby "smearing" the sound when that surface becomes a secondary sound source. The MoPAD product claims sound reasonable enough:
| * Reduces coloration * Increases clarity * Decreases structural resonance |
Long before I started my own acoustics company I was active in audio forums touting the benefit of acoustic treatment to anyone who would listen. Auralex sent me a pair of MoPADs to try, hoping I'd like them and recommend them to others. The JBL speakers in my home studio are huge and weigh 127 pounds each (!), so I visited a friend with Mackie HR824 monitors resting on a wood table riser. After putting his speakers on the MoPADs neither of us heard any difference, and that was the last I thought of it.
|
Over the years I started seeing ads for more and more isolation products. Not only for loudspeakers, but also expensive "isolating" equipment racks and dedicated platforms sold on the premise that CD players and power amplifiers are also harmed by vibration. This has grown into an entire industry with full-color ads in both audiophile and recording magazines. Literally dozens of products claim to improve sound quality by isolating your loudspeakers, subwoofers, and everything else you own including speaker wires!
One fact that isolation proponents miss is sound transmits mostly through the air. Another fact is competent loudspeakers have sufficiently rigid cabinets that don't shake and vibrate very much. Yet another fact is wires and electronic components are mostly immune to vibration. So while it's possible that putting a subwoofer on springs or a rubber platform will reduce coupling to the floor, the majority of sound emits from the driver's cone. If the floor shakes with loud bass notes, that's due to the cone moving rather than cabinet vibration. If you watch a loudspeaker playing music loudly, you won't see the cabinet expand or contract even 1/32 inch. But woofer cones move 1/4 inch or more, and subwoofer cones move as much as two or even three inches! The amount of displacement and total surface area are what determine how much sound is generated by the speaker driver versus the enclosure.
|
An earthquake will probably make your CD player skip because it's a mechanical device, but solid state preamps and MP3 players etc are unaffected by vibration. Audio tubes can become microphonic over time, and when that happens vibration can cause a ringing sound similar to a microphone on the verge of feedback. But again - and this is important - vibrations in the air are much stronger than vibrations passing through a table or floor. If your tubes are ringing from vibration, an isolation product won't help because the tubes are shaken by sound waves in the air rather than through the chassis from underneath.
| In all the years I've seen loudspeaker (and other) isolation products advertised, I have never seen data proving better audio quality. Magazine and online reviews contain only subjective assessments and user testimonials: | |||||
|
|||||
|
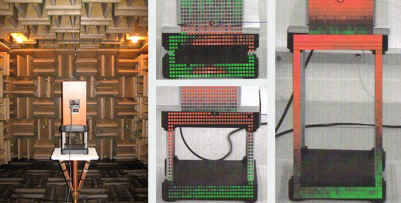
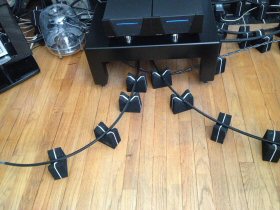
If these products really do affect the sound from a loudspeaker as claimed, it will be easy to prove using standard measurements of frequency response and ringing decay time. The IsoAcoustics Testing page (no longer available) showed the impressive photos at left of a "laser vibrometer" test conducted by the National Research Council in an anechoic chamber in Ottawa, Canada. The photo description is equally impressive sounding. But there's no audio measurement data! These photos show only that vibration (orange) doesn't travel down through the stand to the table (green). At least that's what they claim is shown. Apparently they tested only at 75 Hz, so we'll never know how well this product isolates other frequencies.
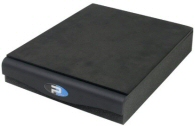
This reminds me of the "data" we see from power conditioner vendors. They show their product reducing a tiny amount of noise on the AC power line, but they never show what happens at the output of the connected audio equipment, which of course is what really matters. Even if the Aperta - or any other product - isolates low frequency vibration completely, that's not evidence that isolation is needed or even helpful.
 |
So I decided to investigate this for myself and for the audio community. I borrowed four commercial loudspeaker isolation products, plus I already had two DIY versions I made, plus no isolation for comparison. So that's a total of seven tests. These products claim to block harmful vibrations from passing to whatever surface the speaker rests on. So I found a rickety old table that has strong resonances at 298 and 475 Hz, and made the short video below so you can see and hear how bad this table is. If loudspeaker vibrations don't excite the obvious resonances in this flimsy table, then nothing will.
This table is ideal because its size is about halfway between a typical speaker stand and a larger desk surface. Most people use one or the other, so this lets us test both surface types at once.
|
)
Testing Isolation
For my tests I used the fabulous freeware Room EQ Wizard (REW) program with my DPA 4090 precision measuring microphone and a Mackie HR624 powered loudspeaker. This speaker is typical of what you'll find in many home studios, and the graph at left shows that it's flat (-3 dB) to below 50 Hz, with usable output as low as 25 Hz.
I put the microphone one meter (39 inches) away from the speaker, standard for loudspeaker testing, pointed at the woofer since we're concerned mainly with frequencies below the speaker's 3 KHz crossover. Putting the microphone closer would have yielded a flatter response, but for this test the absolute response isn't as important as each device versus No Isolation. The graphs below show all seven measurements in three different views: Frequency Response, Waterfall (resonance decay time), and Impulse Response. You're welcome to download the REW data (17 MB Zip file) to view the graphs however you'd like. The next four photos show the setup near a side wall in my home studio, and the individual test photos and REW graphs follow below.
|
||||||||
Click the photos above to see them full size. |
)
)
)
)
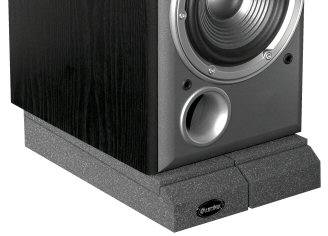
I tested the devices listed below in order of their increasing height, using a riser and plywood shims to maintain the same speaker height. For the No Isolation tests I put the speaker flat on the table as well as elevated, to show how a small difference in height alone affects the measured response. So the comparison graphs labeled "No Isolation" show no isolation at two different heights for comparison. I also tested the IsoNode Isolation Feet both above and below the riser to see if it made a difference (not significant). The DIY isolation pad is made from 2-inch thick 705 rigid fiberglass topped with 3/4-inch plywood for strength, held together with black duct tape. The empty box is made from typical corrugated cardboard.
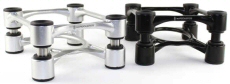
| * No Isolation elevated, also not elevated * IsoNode Isolation Feet (3/4 inch high) * Auralex MoPADs (2 inches high) * Empty Cardboard Box (2-3/8 inches high) * Primacoustic Recoil Stabilizer (2-5/8 inches high) * DIY 705 & Plywood (2-7/8 inches high) * IsoAcoustics Aperta (2-7/8 inches high) |
|
||||||||||||||
Click the individual test photos above to see them full size. |
)
)
)
)
)
)
)
To best show all six devices, plus No Isolation, I created three animated GIF files that flash each graph in sequence for two seconds. The first set of graphs show the frequency response from 20 Hz to 500 Hz. Each slide shows No Isolation in blue plus one isolation device in red as an overlay. I did the same for the waterfall plots showing No Isolation plus each device using the same colors. REW doesn't offer overlays for impulse graphs, so those are displayed in sequence alternating each time with No Isolation for comparison. Remember, in the waterfall plots we're looking mainly for differences at the table's two resonant frequencies of 298 and 475 Hz. Differences at other frequencies can only be due to unavoidable small changes in position, as explained below. Again, the first graph in each set is No Isolation at two different heights, to show how much the data varies when nothing changes except the speaker position. With or without the isolation devices present, the basic shape of the frequency response never changes, just the amplitude along parts of the graph line. You'll notice response changes below 30 Hz, about 35 dB down, which might be air flow noise from my heating system. I doubt it's related to isolation because the change is just as pronounced between both No Isolation tests.
You'll also notice a deep null in all of the graphs at 155 Hz. This is due to "floor bounce" whereby sound from the speaker goes directly to the microphone, but the same sound also arrives at the microphone slightly later after bouncing off the floor. This happens not only when measuring, but also when listening. The microphone was the standard 1 meter (39 inches) distance from the speaker, and the round trip floor bounce distance is 82 inches. So the difference is 82 - 39 = 43 inches. This creates a null at 157 Hz because 43 inches is a half-wavelength at that frequency, which gives 180 degrees of phase shift. Although the microphone appears too low in the photos above, that's due to the camera angle. The microphone was aligned with the woofer by eye as well as possible. Also, all of the resonant peaks you see in the waterfall graphs below are caused by room acoustics, and are unrelated to loudspeaker or table resonances. |
|||||||
 |
These graphs show the frequency response with and without each isolation device. Blue is No Isolation, and Red sequences through each device as labeled. |
 |
Waterfall graphs show the response and decay times versus frequency with and without isolation. Blue is No Isolation, and Red sequences through each device as labeled. |
 |
These graphs show the impulse response with and without each isolation device. |
Flaws With This Test
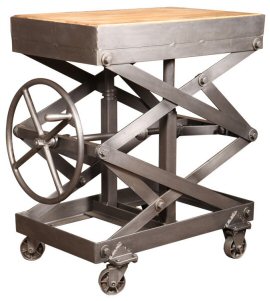
It's imperative that the microphone and loudspeaker be in the exact same place for every test, which turned out to be surprisingly difficult. If either moves even 1/8 inch in any direction, the measured response changes due to both loudspeaker beaming and lobing (its off-axis response) and acoustic peak and null locations in the room. I wish I'd had a variable lift table like the one shown at left. But they're very expensive to buy, and I couldn't find one to rent locally. In fact, I had to do these tests twice because the first time the speaker position varied about half an inch for the different tests. For my first round of tests I stacked 1/8-inch thick cardboard flats under a piece of plywood as shown at right, removing some of the cardboard after each test to keep the speaker at the same height. The inset shows a pair of scissors hung from a mic stand to align a business card taped to the top of the speaker. But even with all these precautions I couldn't keep the speaker in exactly the same spot for each test. To ensure a more consistent loudspeaker height for my second round of tests reported here I decided to raise the speaker rather than the entire table. My friend master craftsman Phil Cramer built a small riser, plus a series of plywood shims letting me adjust the height in 1/8-inch increments. These shims are shown with the test setup photos above. To minimize lateral displacement I taped more business cards to the table to mark all four corners of the speaker, then sighted straight down the edges of the speaker as I repositioned it for each test.
Even with all this care I was still unable to get the loudspeaker in precisely the same spot for all seven tests. One problem was the flimsiness of the table, which shifted slightly even though its legs were taped in place. Another problem was the business cards I used to frame the speaker corners were partly covered by the larger isolation devices. The animated GIF at left shows the slight differences in placement for each test. I'm confident the errors were less than 1/4 inch in any direction, but even that small offset was enough to skew the responses, especially at higher frequencies. Fortunately, these tests are concerned mainly with frequencies below 500 Hz, and especially the two specific table resonances. |
)
)
I'm convinced that the measured changes are too small to account for the "obvious" improvements so many people claim to hear after floating their speakers on isolation pads. Most of the response differences are less than 1 or 2 dB, with the biggest differences at the 155 Hz "floor bounce" null frequency due to slightly different heights. An obvious change, to me, is at least a 3 dB response difference over a wide range of frequencies, or a 30 percent change in decay times. It's possible some people have even poorer tables than the one I used, though I doubt it! So why do people swear that adding isolation improved the sound of their loudspeakers? The frequency response varied less than 2 dB for all these products, which I believe is due to different speaker placements. Further, the impulses barely vary, and the waterfalls vary even less. The differences are all 20-30 dB down, so how could this be perceived as a "more-and punchier-low end" as described by Reviews Editor Andy Hong in Tape Op magazine?
One reason the sound can change is because raising the speakers on isolators puts them higher than they had been. As my Audiophile Beliefs article confirms, moving even a few inches changes the frequency at your ears by a very large amount. You can easily hear this on IsoAcoustics's Difference Page that plays music through two sets of speakers, where the microphones are in different places for each speaker. So the obvious difference heard is due entirely to the microphone for one speaker being off-axis compared to the other speaker!
Other than the change in frequency response due to different speaker placements, which is real and easily measured, I believe the frailty of human hearing tricks people into thinking the sound improved even though it did not. Call it placebo effect, or wishful thinking, or even a misguided allegiance to a magazine's advertisers rather than its readers. The bass didn't really become "much better controlled" (shorter decay times), nor did the speakers produce "better defined mids, clearer highs," nor did "detail and depth improve significantly" as claimed in the various quotes above. If any of those changes really occurred, they'd be clearly visible in my measurements. They are not. Simply lowering the loudspeaker three inches changed the response much more than the difference between no isolation and any of the tested devices.
|
)
Most of the product reviews and user testimonials for loudspeaker isolation products claim they make the bass sound tighter and clearer, less boomy, and better controlled. I've even seen people suggest that speaker decoupling reduces the need for bass traps. For reference, the graph at left shows the bass range response and ringing in a small room with and without six 2x4-foot bass traps. The blue waterfall is the room empty, and the red is after adding the traps. It's easy to see that the response is flatter with bass traps, and all of the modes decay much more quickly. Versus the minimal changes with any of the isolation devices.
So what can we learn from these tests? First, it's clear that moving a loudspeaker even a small amount makes a very real change in the perceived and actual frequency response. So raising your speaker on an isolating stand can change what you hear because of the height difference alone, even if any isolation present had no effect. (It's well known that the correct loudspeaker height puts the tweeter at ear level because that gives the flattest response, so please do that!) But my tests also call into question the hearing acuity of professional recording engineer endorsers, and "golden eared" magazine reviewers, who claimed to hear "obvious" improvements in clarity, bass tightness, and imaging. Either they don't realize the limits of their own hearing, or they all have even worse speaker stands than the flimsy piece of crap table I used!
If anyone reading this believes I missed something, and speaker isolation (or any isolation) makes more difference than my tests show, I urge you to measure the response and ringing for yourself. Then please email me your results, or send me the link where they're posted.
Added January 6, 2018: Speaker isolation came up in a Facebook audio group, and someone posted THIS video that further confirms competent speaker cabinets don't vibrate enough to transfer energy.