 |
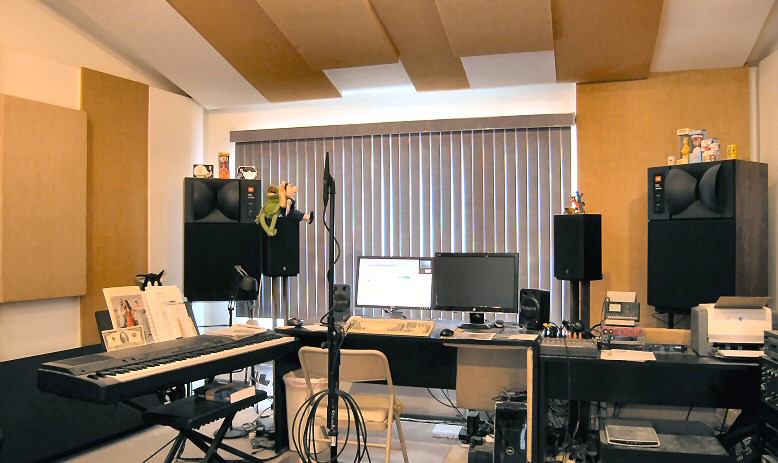
Ethan's home studio measures 33 feet front to back, by 18 feet wide, with a ceiling peak 12 feet high halfway back. |
| www.ethanwiner.com - since 1997 |
Assessing Room EQ - Part 3
I've measured room equalizer (EQ) products twice in the past, and published the results for Audyssey on the RealTraps web site, as well as an article about Dirac and Acourate for ProSoundWeb. More recently I tested Sonarworks (see Update #2 below). I have verified to my own satisfaction that the improved frequency response is localized, and degrades even a foot or two away. Often the response at other nearby locations is made even worse than without EQ. I've also shown that room EQ does not reduce low frequency modal ringing decay times by a meaningful amount all around a room as is often claimed. This is not to say that room EQ is never useful. It can increase low-midrange clarity and reduce boomy sounding bass in rooms that have strong resonances at low frequencies. But EQ proponents insist that modern systems such as Dirac really do flatten the response and reduce modal ringing over a usably large area around a room. So this article documents my third (and final - I promise!) round of tests. Room EQ behaves differently in large versus small rooms, so I did two tests in my large acoustically treated home studio, and a third test in a small empty bathroom.
My studio is 33 feet front to back by 18 feet wide, with a ceiling peak that rises from 8 feet high at the front to 12 feet halfway back, then down to 8 feet in the rear. The photo below shows the front of the room where I placed my DPA 4090 measuring microphone while calibrating Dirac, and again later when measuring Dirac's affect using Room EQ Wizard (REW). The Dirac software plays sine wave frequency sweeps through the speakers to assess the initial response, then it calculates the EQ needed to enforce a flat response. My main monitor speakers are huge old-school JBL 4430s with 15-inch woofers and large horn tweeters, bi-amped with more than 1 KW total power. Both the left and right speakers were active for the tests in this room because that's how most music is recorded. EQ correction is mainly about bass frequencies, and those frequencies are usually centered left-right to emit from both speakers equally. However, Dirac measures and equalizes each speaker separately, which of course is correct. Notice that the "sweet spot" position with these speakers has listeners standing up and about ten feet back. I also use my studio as a jam room to play music with friends, and that height makes sense when using the speakers as a PA system.
|
Ethan's home studio measures 33 feet front to back, by 18 feet wide, with a ceiling peak 12 feet high halfway back. |
Dirac lets you specify one of three rooms types during calibration, and I chose Chair because that seems relevant for most home studios. Many audiophiles also have a single seat optimized for critical listening. If I used the wider calibration area for Sofa Dirac might dilute its correction trying to accommodate the larger space. The Dirac setup insists that the first sweep be at the main "sweet spot" listening position, with subsequent sweeps at nearby locations both horizontally and vertically. But I wanted to be able to put the microphone back to the exact same initial location when I measured Dirac's performance later using REW, so I hung a 1/4-inch phone plug from the ceiling as a plumb bob. If the microphone position is off by even one-quarter inch between calibration and subsequent measuring with REW, that's enough to skew the results for tests like these.
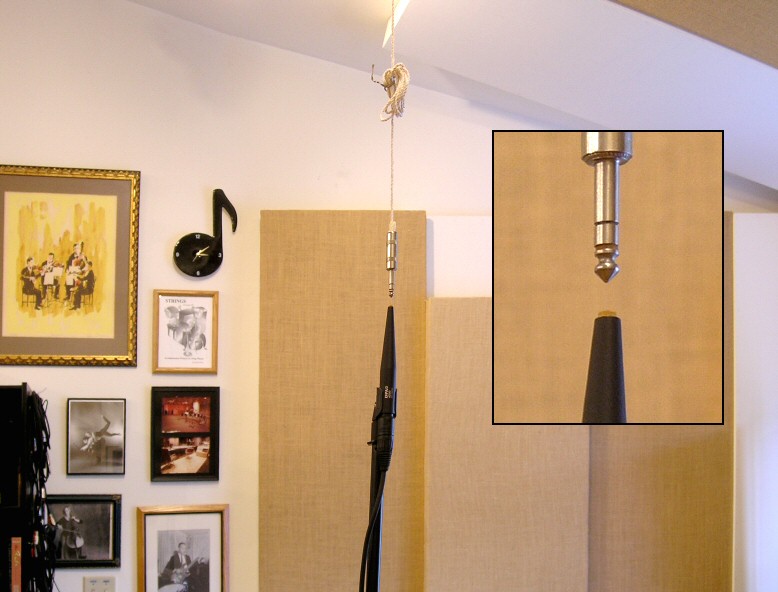 |
A 1/4-inch phone plug served as a plumb bob to ensure precise microphone placement at the sweet spot. |
LARGE STUDIO: So let's see what Dirac was able to do in this large studio space. All of the response graphs that follow have smoothing (averaging) disabled to reveal the true extent of the peaks and nulls. This first graph below shows the measured response With (blue) and Without (red) Dirac engaged. Clearly Dirac made the response flatter at this location, though not so much at the other nearby locations that follow:
 |
This graph shows the response at the studio's main listening position With (blue) and Without (red) Dirac engaged. |
 |
This graph repeats the red Without sweet spot response, then the green With Dirac and orange Without Dirac traces show the response measured one foot behind the sweet spot. As you can see the improvement is starting to fail, though there's still some useful compensation. |
 |
This graph again repeats the red Without sweet spot response, but now the green and orange lines show the response two feet behind the main listening position With and Without Dirac engaged, respectively. Several of the low frequency boosts that Dirac applied have now made the response much worse. This may explain why my perception of Dirac described in the ProSoundWeb article linked above was that it made music sound too bassy. |
Now let's look at the claim that room EQ can reduce modal ringing, which is an extended decay caused by room resonance between opposing surfaces. The usual way to assess low frequency decay times is with a waterfall graph such as shown below. Here the "back wall" of the graph shows the frequency response peaks and nulls, and the "mountains" come forward over time as each resonant peak frequency decays. You can see that the peak at 50 Hz has decayed about 33 dB by the time it reaches the 275 millisecond marker near the front edge.
 |
A waterfall graph shows both the level and decay times of individual frequencies. This graph shows the response and decay times at the main listening position in my studio Without Dirac engaged, based on the same measurement displayed above. |
But a waterfall is not suitable for assessing room EQ because the EQ reduces the peak levels, and that makes their decays "fall through the floor" at the bottom more quickly and wrongly appear to decay faster. So what we really need is a way to assess decay times independent of volume level. And that's what the spectrogram graph type is for. A spectrogram shows the decay time for each frequency without regard to its level. From the REW Help:
| "The spectrogram is like a waterfall viewed from above, with the level indicated by colour. The scale showing how colour relates to level is displayed to the right of the plot. The vertical axis of the plot shows time, increasing towards the top of the plot. The time starts before the peak of the impulse so that the onset of the response can be seen. The areas where the response is decaying more slowly show up as streaks rising up towards the top of the graph. The dashed line shows the peak level in the plot at each frequency." |
Note that when using Spectrograms for comparisons you must uncheck "Normalize to peak at each frequency." Also uncheck "Match top of scale to peak" in Appearance Settings. Otherwise the upper and lower SPL limits might change when you switch from one measurement sweep to another. In order to fairly compare decay times the SPL range must of course be the same for each measurement.
All of the spectrograms in this article are set for a time resolution of 600 ms, which equates to a frequency resolution of 1.7 Hz. Such a high resolution is equivalent to not using averaging on a frequency response graph. The higher resolution better shows individual peaks and their decays even when the frequencies are close together. The first spectrogram below shows the decay times at the main listening position with Dirac turned off. The longest decay is 380 milliseconds (ms) at 37 Hz, with 49 Hz and 69 Hz close behind at about 300 ms each. Captions below each figure explain the spectrograms that follow.
 |
This spectrogram shows decay times independent of level at the studio's sweet spot Without Dirac. You'll notice that every upward decay "trail" aligns with a peak in the frequency response. |
 |
This spectrogram shows the same sweet spot location, but With Dirac engaged. The ringing at 49 Hz is indeed reduced by about 17 percent (290 ms versus 240 ms), but the decay time at 37 Hz is now about 20 percent longer (375 ms Without Dirac versus 450 ms With). Worse, Dirac also extended the decay time when it countered the null at 57 Hz. The high-Q filter boost that Dirac applied at 57 Hz apparently added its own inherent ringing, so there are now decay trails on nulls as well as on peaks. You can see other, higher null frequencies where EQ boost extended the decay times slightly. |
 |
This graph shows the decay times one foot behind the main listening position Without Dirac. You can see that the lowest peak at 37 Hz decays for longer at this location than at the main position Without Dirac two graphs above. As an aside, this busts the common myth that modal decay times don't vary around a room. |
 |
Engaging Dirac one foot back also extends the decay times at 37 Hz and 57 Hz, though 49 Hz is still improved. |
 |
Moving back two feet behind the main spot, 37 Hz now decays for even longer Without Dirac. |
 |
And yet again, at two feet back 49 Hz is still improved With Dirac enabled, while 37 Hz and 57 Hz are made worse. |
Earlier I said that I chose Chair correction because I didn't want Dirac to dilute its improvement by trying to accommodate a larger area. To test that theory I calibrated Dirac using only one position rather than the nine it expects. This was a separate test done on a different day, before I hung the plumb bob, so the graphs below vary slightly from the above. However, the microphone was kept in precisely the same place for both the calibration sweep and later testing with REW. It's not surprising that the response is made even more flat at the sweet spot, and the ringing decay at 49 Hz was improved even more than with nine calibration sweeps. But as expected, the improvements degrade quickly a foot or two away. These graphs show how well Dirac affected only the one sweet spot:
 |
When Dirac is calibrated to optimize only a single location, it flattens the response (blue) even better. |
 |
Calibrating only one location also reduces decay times better. Without Dirac the 49 Hz peak decays for 300 ms. |
 |
With Dirac engaged that 49 Hz peak is completely obliterated, even more than with the nine calibrations above. |
SMALL BATHROOM: Now let's see what Dirac was able to do in my small bathroom. My studio has a modest amount of bass trapping, so Dirac didn't have to work as hard there as in this much smaller untreated space. As mentioned, Dirac lets you specify one of three rooms types during calibration, and again I chose Chair. For each sweep I followed the basic mic placement guide shown on Dirac's calibration screen, though I only moved the stand around without varying its height. Masking tape on the floor let me get the microphone back to the exact same prime location, without having to hang another plumb bob from the ceiling to ensure the same height too. I used a Mackie HR624 powered monitor because that's what I had available, but the room is only 10 feet long so its lowest mode at 56.5 Hz is safely above the low frequency limit of this speaker:
 |
This is the published frequency response for the Mackie HR624 powered monitor speaker. |
Nobody listens to music in this room, so I established the "sweet spot" at 38 percent back from the front wall as is standard for listening rooms. The speaker was on a small table placed near the front wall, with the microphone directly on axis at tweeter height. Again, the comments below each graph that follows explain what's being shown:
 |
This graph shows the response at the main "listening" position in the bathroom With (blue) and Without (red) Dirac engaged. The low frequency response in this small untreated room is worse than in my large studio, but again Dirac did a good job of flattening the response at the prime location where I ran the calibration sweeps and later measured. |
 |
This graph repeats the red prime location Without response, and the green With line shows the response one foot behind that spot with Dirac engaged. As you can see, the improvement is again starting to fail, especially at frequencies below 70 Hz. |
 |
This graph also repeats the red prime spot Without response, with the green line showing the response two feet behind With Dirac engaged. The low frequency improvement here is now completely lost, and made even worse at 60 Hz and below. |
Now let's consider how the decay times in this small room are affected with Dirac.
 |
This spectrogram shows decay times versus frequency in the bathroom's "sweet spot" Without Dirac. |
 |
This shows the same sweet spot location With Dirac engaged. The ringing time for the peak just above 70 Hz actually increased, though the next few higher peaks are slightly improved. As in the studio, the null decay times increased, such as at 62 Hz. |
 |
One foot behind the prime spot, many of the peak ringing times With Dirac engaged are still slightly improved. |
 |
At two feet behind the main spot most of the gains with Dirac are now gone, and some peak frequencies were made worse. |
CONCLUSION: I believe that room EQ is useful in rooms where peaks are the main problem. But in many rooms the larger problem is two or more deep nulls in the bass range, and boosting those frequencies to compensate is not a good idea. One reason is that can add ringing as shown above. But boosting also reduces headroom and increases distortion in the loudspeakers. Peaks are localized, though not as localized as nulls. They're also wider, so a lower Q filter can be used reducing the chance of increasing decay times. Reducing a peak by only half as much as indicated is also a good idea, because it's less likely to damage the response at nearby seats. An even better solution might be to move the speakers very close to the front wall to benefit from boundary reinforcement. Then the EQ will counter that gain which increases headroom and reduces distortion.
But more to the point of these tests, it's clear in both the studio and bathroom tests that even two feet away some frequencies were increased much more than they should be. That's exactly what happened with Audyssey as noted in that article also linked above. So this disproves the claim that EQ can improve the response for all seats in a home theater, or for a studio's mix position and the client couch behind. These tests also confirm that EQ can't reduce modal ringing by a meaningful amount at most frequencies. The largest reduction in decay time for the studio test was 17 percent at 49 Hz. That reduction equates to 1.6 dB which is hardly significant. Versus bass traps that reduce decay times substantially at all bass frequencies, and never increase decay times at any frequency:
 |
High quality bass traps are effective down to 40 Hz or even lower if you have enough of them. |
So it's clear to me that the very best approach is to have as many bass traps as you can manage, then optionally use EQ to reduce only the worst few low frequency peaks that remain. The EQ probably won't improve the ringing, but just lowering the level of a loud obnoxious peak can greatly improve clarity. Adding a second subwoofer is also a good way to fill in nulls that are too low for bass traps to handle completely below the typical 80 Hz sub crossover frequency. Further, a room doesn't have to be perfectly flat to sound excellent. If you can reduce the bass range peak-to-null span from the typical 30+ dB down to 10 dB, your room will sound much better than the majority of "high-end" audiophile rooms that have no bass traps at all.
I want to be clear: This report is not an indictment of Dirac. None of the room correction systems I've tried do what they promise! It is simply impossible for any device inserted into an audio signal path to negate reflections and other time-based problems created by the room after the sound has left the loudspeakers. Glowing user reports and magazine reviews claiming increased clarity are due entirely to reducing the level of prominent boomy peaks, not from any improvement of time-related problems. I also think that Dirac should limit itself to reducing peak levels and leave the nulls alone, or at least limit boosts to maybe 5 dB or so. However, Dirac lets users tailor the correction, so you could manually reduce or even disable the null frequency boosts leaving only the peak frequency cuts.
Finally, as I said above, this is the last time I plan to test room EQ "correction" products and methods. If anyone disagrees with my results, I'll be glad to see your own tests proving my conclusions wrong. The response graphs and spectrograms above show how room EQ is assessed, and that's the type of data that should be presented. So if someone believes that Dirac or another type of room EQ would do a better job, please test that and publish your results! I'm not interested in theories, or quotes from "experts" in the field. The only proof that's acceptable is empirical results similar to what I've shown here. But smoothing must be disabled for frequency response graphs, and spectrogram and waterfall windows need a resolution of 500 ms (2 Hz) or better. I look forward to your results.
QUICK UPDATE: Several of my Facebook friends said I should have selected Sofa instead of Chair when calibrating Dirac with all nine sweeps in my studio, because that would extend the improvement farther away from the single sweet spot. So two days later I ran another battery of tests and got basically the same results as my first tests. I considered adding the Sofa response graphs and spectrograms to this article, but it's already too long so I didn't bother. Of course I have all the data from all of my tests saved, in case anyone insists I show that in the future.
UPDATE #2: In September, 2020 I was offered the chance to test Sonarworks Reference 4, another popular room EQ product. Again, this article is already too long, so I won't include the full battery of screen shots. But I can relate what I found, along with two key graphs.
In general I liked calibrating and using Sonarworks more than Dirac. The on-screen guidance for moving the microphone around the listening area during the many sweeps for calibration is excellent, and much more precise than Dirac. I also like that during this calibration Sonarworks reports the precise distance between the measuring microphone and each speaker. It was good for me to have confirmation that my plumb bob is in the exact correct place. More important, Sonarworks sounds good engaged, and doesn't boost the bass too much as Dirac did in my tests. However, during the calibration sweeps you're told to hold the microphone rather than use a mic stand, which seems unwise. So I used a microphone stand to avoid any handling noise or slight movement from corrupting the calibration.
Like Dirac, Sonarworks inserts itself into the Windows audio system so you don't have to add a plug-in to the monitor path of your DAW software as with IK Multimedia's ARC. With a plug-in you need to engage it while mixing, then remember to bypass it before you export the mix to a Wav file. Sonarworks also includes a plug-in version, but I didn't try that because my intent was to measure what it does and listen to finished tracks, rather than try to mix with it. When I tested Dirac, Room EQ Wizard (REW) was properly re-directed to the Dirac audio driver which in turn sent the test sweeps out through my Focusrite Scarlett 8i6 sound card. But apparently Sonarworks doesn't insert itself deeply enough into the Windows playback path, because REW bypassed Sonarworks making it impossible to measure with and without its EQ engaged. I was also unable to get the DAW program I use to pass through Sonarworks, though Windows Media Player was properly re-directed, and Sound Forge showed Sonarworks as an available output device. Fortunately, REW has an option to use its own Java audio driver, and that let me route audio through Sonarworks for testing. While using the Java driver I heard some clicks and pops during the frequency sweeps, but apparently REW filtered those out because they don't show in the various response and decay graphs.
As with every other room EQ I tested, Sonarworks made the response worse at other locations when engaged. But the degradation is not as bad as I measured with Dirac and Audyssey. However, as with all of the other EQ products I tested, Sonarworks increased ringing at the lowest frequencies as shown in the spectrograms below.
 |
This spectrogram shows decay times versus frequency in the studio's "sweet spot" without Sonarworks. |
 |
This shows the same sweet spot location with Sonarworks engaged. The ringing times below 200 Hz increased as expected, though at higher frequencies they're slightly improved. |
UPDATE #3: One of my friends at Facebook pointed out that all of the room EQ programs he's tried, including Sonarworks, applies different EQ to the left and right speakers. He said that creates an undesirable fake stereo widening effect. I didn't test for that, but it makes sense because that's how stereo "wideness enhancer" plug-ins and hardware work. They change the response (or just the phase) of the left and right channels differently.
Ethan Winer has been an audio engineer and professional musician for more than 50 years, and is a principle at RealTraps where he designs acoustic treatment products for recording studios and home listening rooms. Ethan's Cello Rondo music video has received nearly 2 Million views on YouTube and other web sites, and his book The Audio Expert published by Focal Press, now in its second edition, is available at amazon.com and his own web site.
Entire contents of this web site Copyright © 1997- by Ethan Winer. All rights reserved.